


Google Lighthouse : Score Guide for SEO
How is the PageSpeed Insights score , which is based on Lighthouse, calculated? Which web performance metrics are included in the score calculation, and with what importance? What is the difference between the two versions of the Lighthouse score? We help you see clearly and understand the impact on your PageSpeed score.Google Lighthouse v10: the definitive removal of Time To Interactive in the score
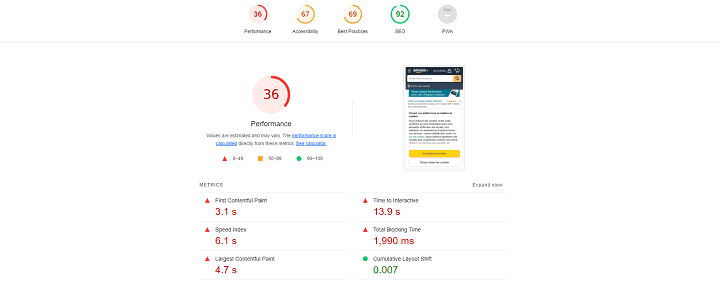
Lighthouse is a free tool that allows you to evaluate the performance of a web page based on different indicators. In addition to providing an overall score, Lighthouse also performs a detailed audit of the tested page, identifying performance issues and opportunities for improvement. It is accessible in particular via the Chrome extension made available by Google, via a local installation or the best known: via PageSpeed Insights. 5 webperf metrics are taken into account:
As a reminder, here are the ones that were used for v8 :
- First Contentful Paint
- Speed Index
- Largest Contentful Paint
- Time To Interactive
- Total Blocking Time
- Cumulative Layout Shift
In this new version of Lighthouse, the weight given to Core Web Vitals is more important. The Time to Interactive disappears and the weight of the Cumulative Layout Shift increases from 15% to 25%.

Weight distribution of webperf metrics in the calculation of v10 of the Lighthouse score vs version 8
Time To Interactive weight no longer impacts Lighthouse score in version 10
This is the major change in version 10, Time to Interactive is no longer taken into account in the Lighthouse score . The 10% it represented in the Lighthouse score is now allocated to CLS .
A metric subject to discussion, the Time To Interactive (TTI) represented 33% of the v5 score, it already went to 15% in v6 to reach 10% in v8/v9. But while interactivity has more and more importance in the evaluation of web performance, why reduce the weight of the TTI? Simply because it is not perfectly reliable.
The weaknesses of Time To Interactive
Its limitation lies mainly in the fact that the TTI is supposed to indicate a potential moment when the page becomes interactive, but many sites see this TTI delayed because of Third Parties (personalization, tracking, chatbot , etc.), without the interactivity being degraded in practice for the user. The weight of the TTI in the calculation of the Lighthouse score was therefore penalizing, particularly for these sites.
The weaknesses of TTI are also explained by Boris Schapira . This indicator should actually be called “Time To Consistently Interactive”, since in fact, it does not indicate “ the moment when the page becomes interactive ”, but the moment when the page becomes interactive in a sustainable way and without latency . In a few words (the whole article will really allow you to understand its subtleties):
“TTI is a measure of interactivity that does not rely on actual user interactions. Instead, the algorithm approximates that a satisfactory interaction can only occur under specific conditions and is interested in determining when those conditions occur.”
In Lighthouse V10, Core Web Vitals account for 80% of the performance score calculation
The final removal of the TTI also aims to highlight the importance of CLS, as a Vital Web Core. Moreover, since version 6, its weight in the score has been multiplied by 7!
Google expects this change to improve the performance score of most pages, as most pages tend to perform better on CLS than on TTI.
In the latest HTTP archive scan (13 million pages analyzed), 90% of these pages had a better Lighthouse score after removing TTI. Additionally, 50% of these pages saw their score increase by 5 points or more.
What is the impact of v10 on PageSpeed Insights score compared to v8?
Are you curious to test the performance of your site in relation to the different versions? Here is a simulator (illustrated below), offered by Google that allows you to easily compare your score from one Lighthouse version to another. You will also find the weight of each metric.

Lighthouse score simulator according to different versions
Despite the changes made in the calculation of the Lighthouse score, and the importance given to Core Web Vitals, the variations in the score are not obvious. We did the test: the score of the chosen site is divided by almost 3, with Google’s developments. So not all sites are winners, with the removal of the TTI!
Why these changes from Google in the calculation of the Lighthouse score?
The indicators that have been abandoned since v5 had shortcomings that the following versions v6, 8, 9 and 10 compensate for. Overview of the major developments since version 8 and the reasons that motivated them (and to follow the next developments, we invite you to subscribe to our monthly newsletter , we keep an eye open for you!)
Why do indicators and their weight change over time?
Since version 5, Google has made changes to the calculation of the Lighthouse score to better match user requirements and expectations in terms of web performance. Furthermore, these changes were motivated by the need to best reflect, with the most reliable metrics, the user experience on web pages.
This is why FCP and TTI were initially added and considered important, then re-evaluated: weight reduction or deletion (as is the case of time to interactive).
Changes to CLS in version 8
Aside from the extra weight given to Cumulative Layout Shift (it had tripled between v6 and v8, and multiplied by 1.7 by v10), one of the significant changes in v8 is the change made to this metric itself. Indeed, CLS, which is part of the Core Web Vitals , is now calculated on a maximum session window with a 1-second gap, capped at 5 seconds . The goal is to better reflect the user experience for long-lived pages. By giving more weight to CLS, the resulting Lighthouse score is supposed to be better.
If you’re wondering how to optimize CLS, one of the two metrics* that gained weight in Lighthouse version 8 (and then in version 10 for CLS), here are some essential tips.
*: The second metric was TBT.
How to improve the CLS, whose weight is still increasing in the calculation of the Lighthouse v10 score?
- Specify the dimensions of image content, advertisements, and iframes on your pages
- Optimize your fonts and their display to avoid a FOIT / FOUT
- Optimize your animations and dynamically integrated content
- Avoid actions that require a network response before updating DOM
You can find details on Cumulative Layout Shift optimization techniques in this detailed article.
This new method of calculation seems to us to allow us to move in the right direction. Indeed, it better addresses the notion of interactivity with indicators that are increasingly close to the perception of Internet users.
Now that you know how Google evaluates your performance,
you want to know how to improve your loading speed sustainably?
Discover the method applied by the most successful e-commerce sites:
![]()

